Introduction to Global Warming
If we suppose that planet Earth is four and a half billion years old, then the phenomenon of global warming is just approximately two hundred years old.
What exactly is global warming? Simply expressed, it is the rise in temperature in the lowest layer of the Earth's atmosphere due to the production of vast volumes of carbon dioxide, methane, and other gases.
What connection exists between rising temperatures and greenhouse gas emissions? The mechanism of global warming itself holds the answer. It is well recognized that the sun is the planet Earth's main source of heat.
Furthermore, once sunlight strikes the Earth's surface, a portion of the heat is naturally absorbed, while the remainder of the heat is reflected back into space.
During this process, heat passes through the atmosphere, which today contains large amounts of carbon dioxide and methane—commonly referred to as greenhouse gases.
The issue lies in the fact that greenhouse gases have a remarkable capacity to absorb heat, preventing surface-reflected heat from escaping into space and trapping it within the Earth's atmosphere. As a result, this contributes to an increase in global temperature.
The Problem Statement
Global Warming and Its Impact on Egypt
1. Rising Sea Levels
Studies suggest that by the end of the century, sea levels in Alexandria and the Nile Delta might rise by 50 to 100 centimeters. Approximately 7 million people would be impacted, and around 30% of food production in these areas would be at risk if 12% to 15% of the Delta's lowlands were submerged.
2. Water Scarcity and Drought
97% of Egypt's water demands are met by the Nile River. Global warming may decrease the flow of the Nile by as much as 15% by 2050, severely affecting Upper Egypt's agriculture and irrigation.
3. Effects on Agriculture
Over the next several decades, Egypt's temperature is predicted to increase by 2 to 3 degrees Celsius. This rise could significantly affect crop output, with wheat yields potentially declining by up to 11% and maize by 19%.
4. Increased Heat in Major Cities
Cairo may experience a considerable increase in the number of intense heat wave days, jumping from 8 days at the beginning of the century to approximately 50 days by 2050.
5. Health Impacts
Rising temperatures will lead to increased heat-related disorders, particularly in cities like Cairo, Giza, and Aswan, along with declining air quality leading to more respiratory ailments.
Monitoring Greenhouse Gases
Methane (CH4) and carbon dioxide (CO2) concentrations are measured using various sophisticated methods:
- Infrared Absorption Analysis: This technique relies on the gases' ability to absorb infrared light at specific wavelengths.
- Laser Analysis: Methods like Tunable Diode Laser Absorption Spectroscopy measure gas concentrations through laser beams.
- Laboratory Examination: Air samples are analyzed in labs using equipment like mass spectrometers and gas chromatography.
- Satellite Sensing: Satellites like TROPOMI and GOSAT gather data on global gas quantities through light absorption.
- Ground Monitoring Stations: Fixed sensors assess gas concentrations continuously, such as the Mauna Loa Observatory.
- Drones: Drones equipped with sensors monitor gas concentrations in hard-to-reach areas.
How EcoSphere Works
Pre-Processing
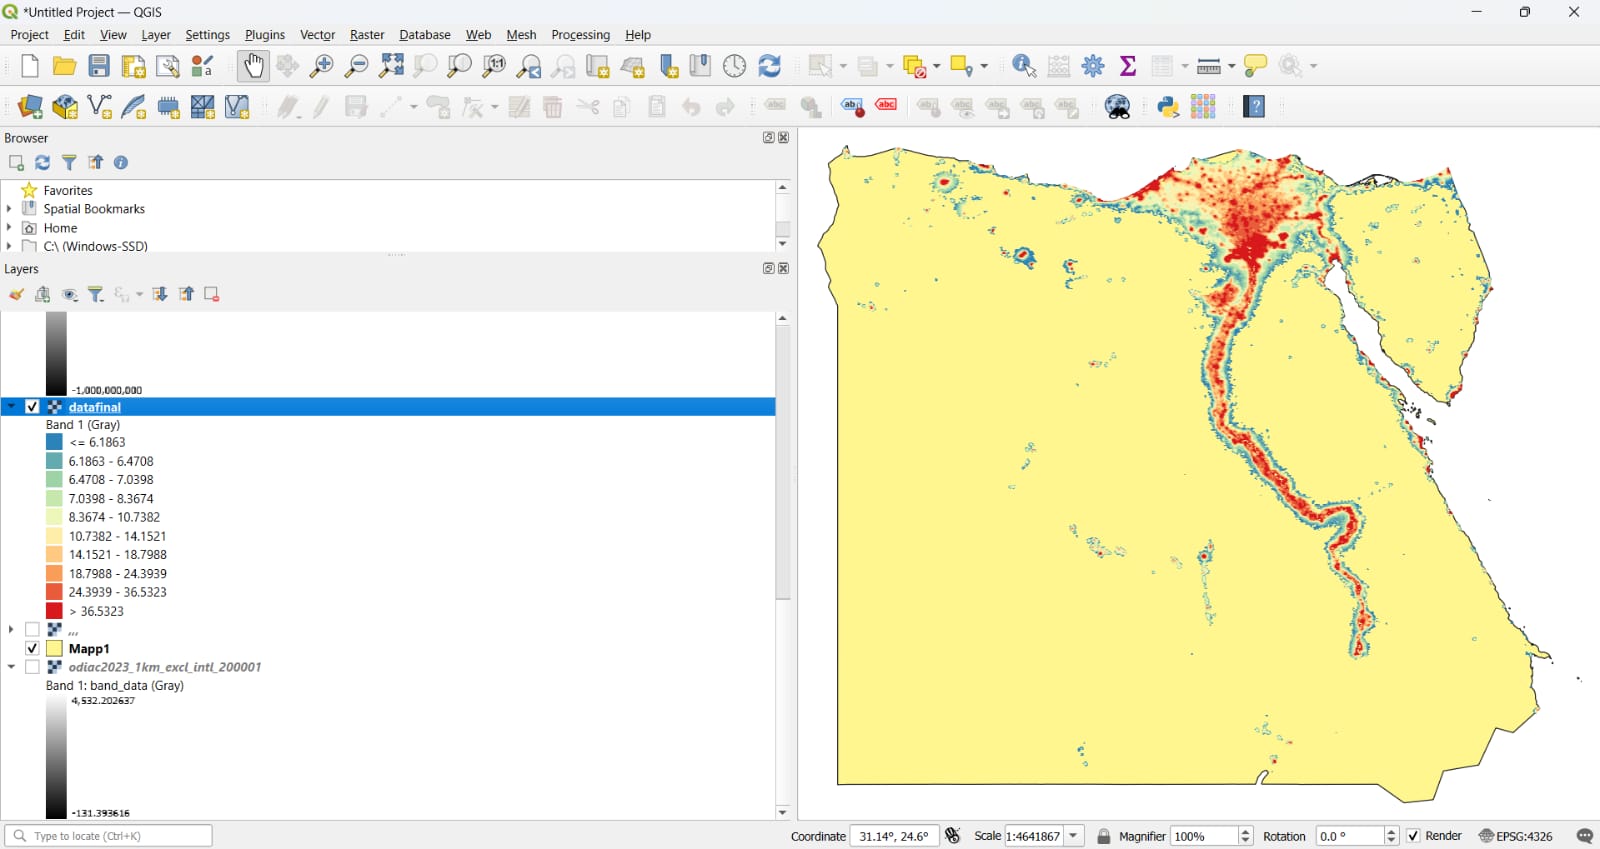
We begin by analyzing and processing data on fossil fuel emissions using QGIS. This includes clustering emissions data through different regions of Egypt. The process involves masking Egypt out of the global map to focus on local emissions patterns.
User Interface (UI)
Users can interact with the EcoSphere system by selecting specific governorates within Egypt. They can generate detailed reports on the emissions from factories in those selected areas.
Integration of AI
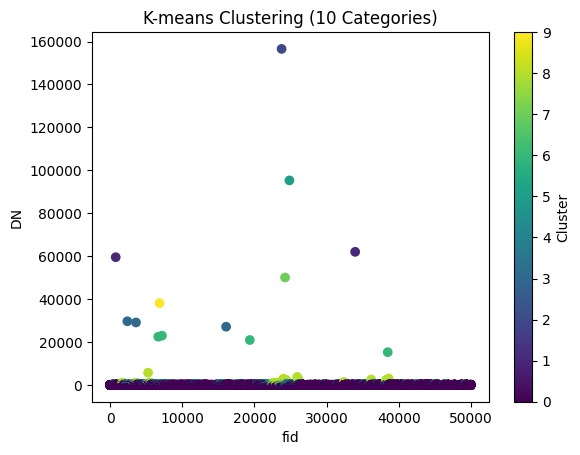
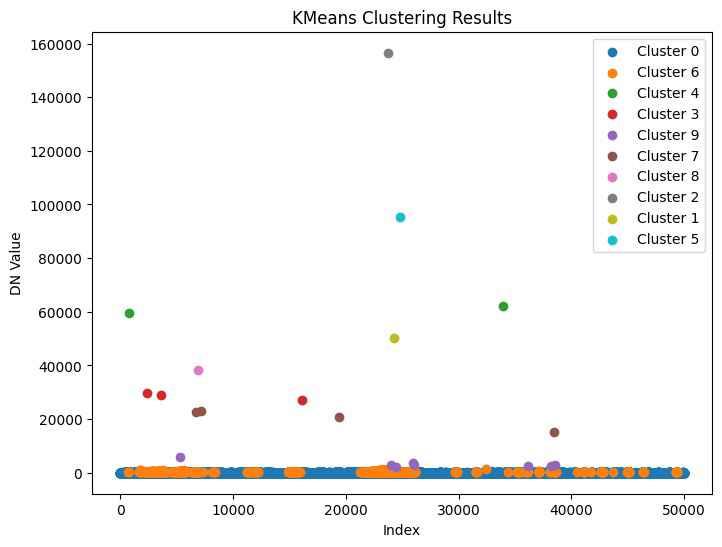
Unsupervised Machine Learning techniques are integrated into the system. K-Means clustering is used to group the processed emissions data into 10 distinct clusters based on pixel density and distribution.
The resulting clusters display unique groupings of emissions data, helping to identify patterns and trends across the region.
Cluster of DN Values
K-MEANs Clustering Results
Cluster of DN Values Showing 10 Distinct Groups
This graph illustrates the different clusters identified from the DN values, indicating how different emissions profiles are represented.
Meet Our Team

Islam Hani Abdelmoaty
Team Leader

Mariam Mohamed Fathi
AI Engineer

Khaled Muhammad Ibrahim
Senior Web Dev
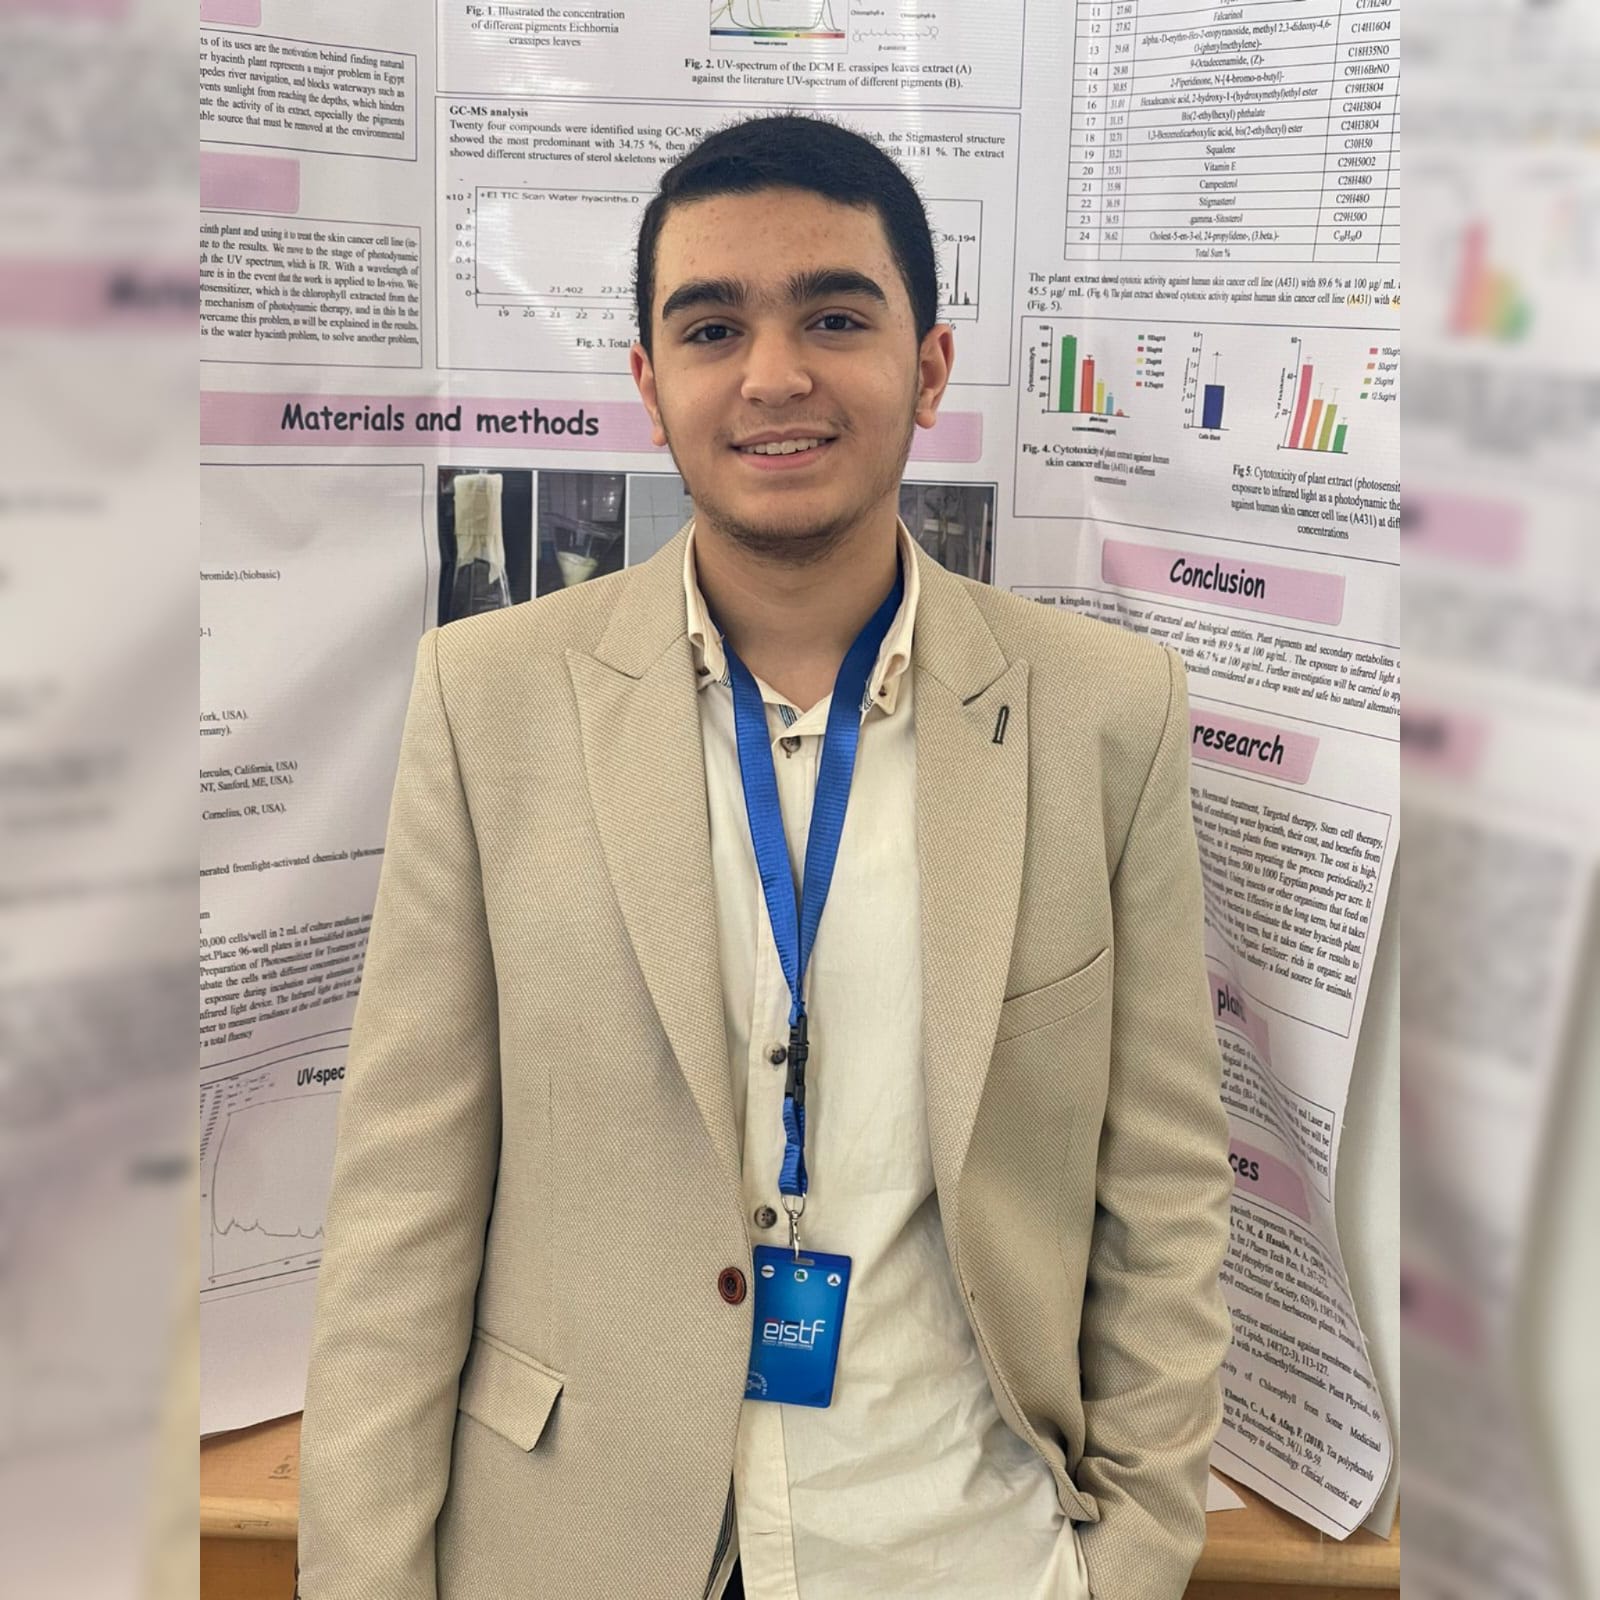
Hamdy Gamal Hamdy
Researcher

Youssef Yahia Zakaria
Designer / Video Editor / Motion Graphics